Read the presentation that accompanied co-founder David Aviram’s testimony to the Rent Guidelines Board of New York City. Maverick’s granular data and insights help the board make better policy decisions. Key points include:
$131 billion in mortgage debt is tied to rent-stabilized buildings city-wide.
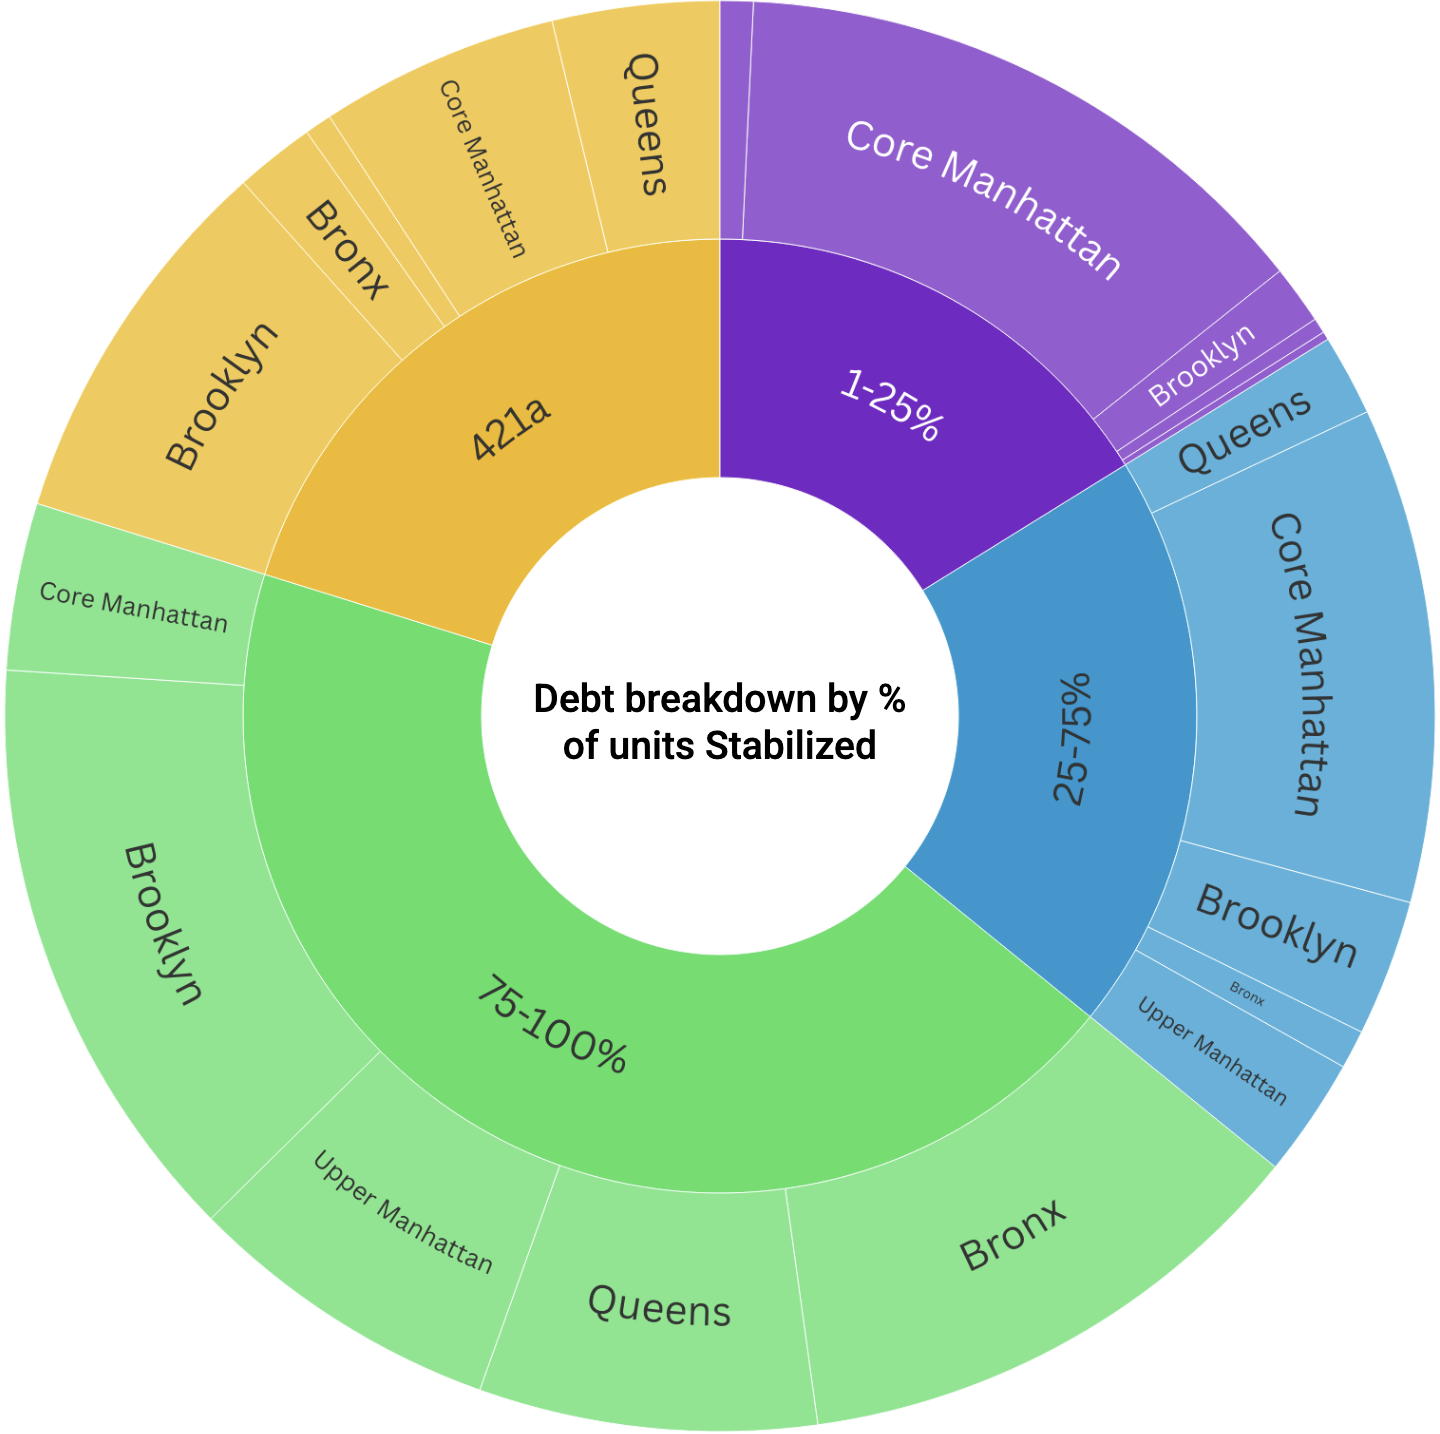
45% of that sits on properties where ≥75 % of units remain regulated.
New originations on highly regulated assets have collapsed >70 % versus pre-2020 norms. Liquidity is at an all-time low.
In multiple boroughs, sale prices per SF are at—or below—outstanding debt, implying negative equity for nearly half the owners.
Buildings that are ≥75 % regulated carry 4× the housing violations per unit of their less regulated peers.
“Mom-and-pop” landlords (<50 regulated units) have 2× the violations per unit of institutional owners.
Last Sunday, March 19, 2023, New York Community Bank (“NYCB”) acquired certain assets and assumed certain liabilities of Signature Bridge Bank (“Signature”), leaving behind its fund finance business, its digital asset business, and most relevant to us, its $34B commercial real estate (“CRE”) loan portfolio, $24B of which we estimate to be in NYC (and $11B of which is rent stabilized). This FDIC-orchestrated transaction has left many wondering what’s inside the Signature CRE portfolio, and what will happen to these loans.
There are about 3,600 NYC loans in the Signature portfolio. The below chart plots each of the loans in excess of $1M. Roll over any dot for info about the loan.
Signature was the third largest NYC CRE lender over the last five years (after JP Morgan Chase and Wells Fargo), but number one among regional banks, and the largest lender for middle-market borrowers (for loans up to $100M). The chart below shows the scale of their activity relative to other New York-area regional banks. Their absence from the market going forward will leave a significant gap that will need to be filled by other banks or private lenders.
The significant volume of new originations to rent stabilized properties after June of 2019, when major changes were made to the rent regulation laws by New York State, is noteworthy. Generally, those changes capped rent growth rates permanently on stabilized units, while expenses tend to grow at a much faster rate. Initially, these properties still likely met underwriting standards – because interest rates were so low at the time and in-place cash flows did not drop immediately. However, the regulation changes yielded properties that are declining in value and, as a result, owners are disincentivized from putting any cash back into the properties. These conditions are exacerbated by rising interest rates – making it extraordinarily difficult to refinance or sell these properties.
When looking at the vintage of loans in the Signature portfolio by origination date in the chart below, the percentage of its current portfolio that is made up of loans to Rent Stabilized properties after the 2019 law change stands out:
According to NYCB’s press release after their acquisition, “The Bank acquired only certain financially and strategically complementary parts of Signature that are intended to enhance our future growth.” It’s understandable that NYCB was not interested in more exposure to rent stabilized loans. The following chart suggests another reason:
The average debt per square foot across Signature’s rent stabilized loan portfolio has grown since 2019, while NYCB’s dropped and remained relatively flat. Signature’s rent stabilized portfolio has an average debt per square foot that is materially higher than NYCB. While that may be explained away by higher property values at Signature on a per square foot basis, we don’t think that is the case. The chart below shows Signature lending at higher LTV (based on NYC Department of Finance Market Assessed Values) and a higher Debt Per Square Foot than their competitors, at scale.
Since the 2019 rent regulation changes and through the COVID pandemic, regional lenders in NYC have faced major headwinds in their real estate loan portfolios. Significant changes have been made in the way we work, live, and shop and it affects our real estate. The current economic environment is forcing a reckoning. Signature is not alone in these challenges though they are unique in some of the attributes of their portfolio.
Signature’s absence from the lending market may create further challenges for other banks and property owners, as its impact and scale in the NYC CRE market cannot be understated.
Maverick Real Estate Partners is an investment manager that invests in real estate credit in New York City. For inquiries about this analysis, please email us at info@maverickrep.com.
Signature Bank has significant meaning to Maverick Real Estate Partners because it was our first credit and deposit relationship when we founded our business thirteen years ago. Our multifaceted ties remain strong with their team of professionals who are experts in their field. We were surprised when the FDIC took them over, yet expect our relationships to endure however the situation plays out. Much has been reported about Signature Bank in the last few days, yet we’d like to share with you a unique and hopefully helpful perspective as we all navigate this challenging market.
Maverick utilizes data to seek out attractive credit opportunities and develop market intelligence to help inform our decisions. For a high-level perspective, we charted the top Commercial Real Estate (CRE) lenders in New York City since 2018 based on dollar volume and number of transactions below:
Signature Bank is the third largest commercial real estate lender in New York City by total dollar volume, and is the number one lender to the middle market for loans under $100 million. The chart below breaks down Signature Bank’s current New York City CRE portfolio by property type:
While New York City office demand has plummeted causing significant distress, Signature Bank’s office portfolio is only 14% of its NYC CRE book. From what we’ve analyzed, those loans appear to be secure. As noted in the chart above, Signature Bank has 43% of its commercial real estate loans in rent stabilized multifamily. The loans are scattered across the city, as noted on the interactive map below:
Those lighter green dots represent rent-stabilized properties, illustrating how important Signature Bank is to the rent-stabilized market in New York City. Yet rent-stabilized property values have been absolutely crushed over the last four years, due to several factors:
Severe Rent Restrictions: 2019 Housing Stability and Tenant Protection Act severely restricted a landlord’s ability to raise rents on vacant units in rent-stabilized properties.
Decreasing NOI: Real estate taxes on NYC rent-stabilized apartment buildings have increased by 13.0% over the last four years, while regulated rent growth during that time was only 6.4%.
Legal Risk: If landlords do not have complete records that prove that they legally deregulated units, tenants can sue and have rents retroactively reduced to regulated levels.
Rising Interest Rates: Interest rate increases have led to cap rates expanding by over 200 basis points.
The net effect is that rent stabilized apartment buildings have decreased in value between 20% to 65% since early 2019, depending on how large the spread is between a building’s regulated rents and market rents. The bigger the spread, the worse the decline.
While Signature Bank is exposed to this dynamic, it wasn’t the only lender to the rent stabilized market, nor the largest. New York Community Bank (“NYCB”) has a portfolio of rent stabilized loans that is 40% greater than that of Signature Bank per the chart below:
The y-axis plots the dollar amount of the rent stabilized loan portfolio of each of the banks. The x-axis is a ratio that takes the same portfolio size divided by the market value of the properties, as determined by the NYC Department of Finance. While not reflective of actual market value, it serves as a reasonable gauge to compare rent-stabilized multifamily portfolios of different banks on an apples-to-apples basis. NYCB’s and JP Morgan’s estimated LTV are meaningfully lower than Signature Bank’s estimated LTV for rent stabilized loans. If Signature Bank exits the market, and other lenders don’t increase proceeds beyond their current standards, borrowers will likely need to contribute equity while private lenders fill the gap. In some cases, loans will need to be restructured or sold at discounts. It should also be noted that Customers Bank and Peapack-Gladstone Bank, while smaller, were far more aggressive in their lending practices when compared to Signature Bank, and may have more fallout when their loans mature.
Rent stabilized multifamily properties in New York City experienced a paradigm shift in 2019. Lenders didn’t meaningfully reconcile issues as the low interest rate environment gave them the option of “kicking the can down the road”. We’re now in harder times, and if Signature is out of the market, there’s more pain coming for us all. Cap rates are high, liquidity is low, and rents are… stabilized.
Maverick Real Estate Partners is an investment manager that invests in real estate credit in New York City. For inquiries about this analysis, please email us at info@maverickrep.com.
Note: This analysis, originally posted 3/16/23, was updated on 3/27/23 to incorporate improved data, notably inclusion of more recent DHCR rent stabilization data and additional cleaning of erroneous records in public data sets.